Complete each problem below by hand. Show your work and provide a reason for each step. Calculators are not allowed on this assignment.
Consider the following data:
Algebra II Scores
| Grade | 70-72 | 73-76 | 77-79 | 80-82 | 83-86 | 87-89 | 90-92 | 93-96 | 97-99 |
|---|---|---|---|---|---|---|---|---|---|
| Frequency | 0.01 | 0.05 | 0.1 | 0.07 | 0.13 | 0.24 | 0.29 | 0.08 | 0.03 |
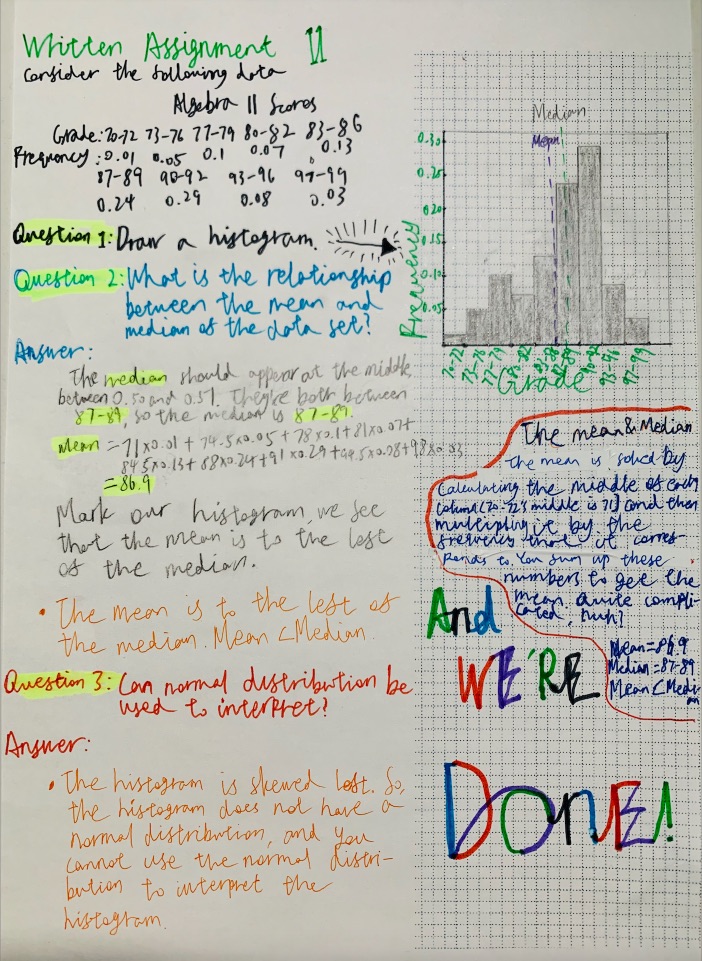
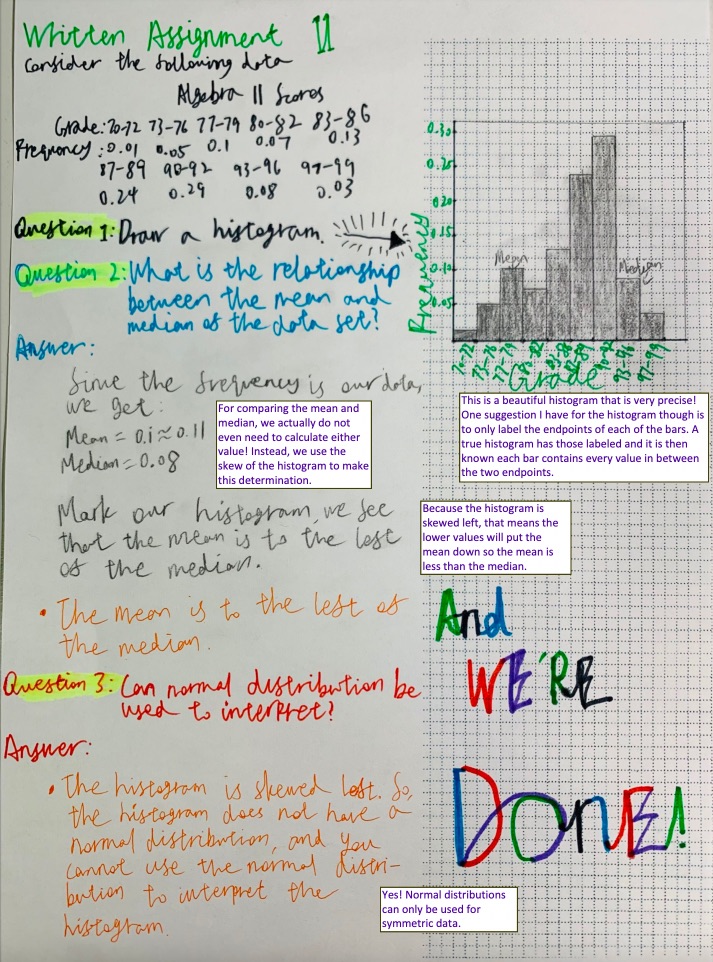
- Draw a histogram to represent the data.
- What is the relationship between the mean and median of the data set?
- can normal distribution be used to interpret?
Consider the following experiment:
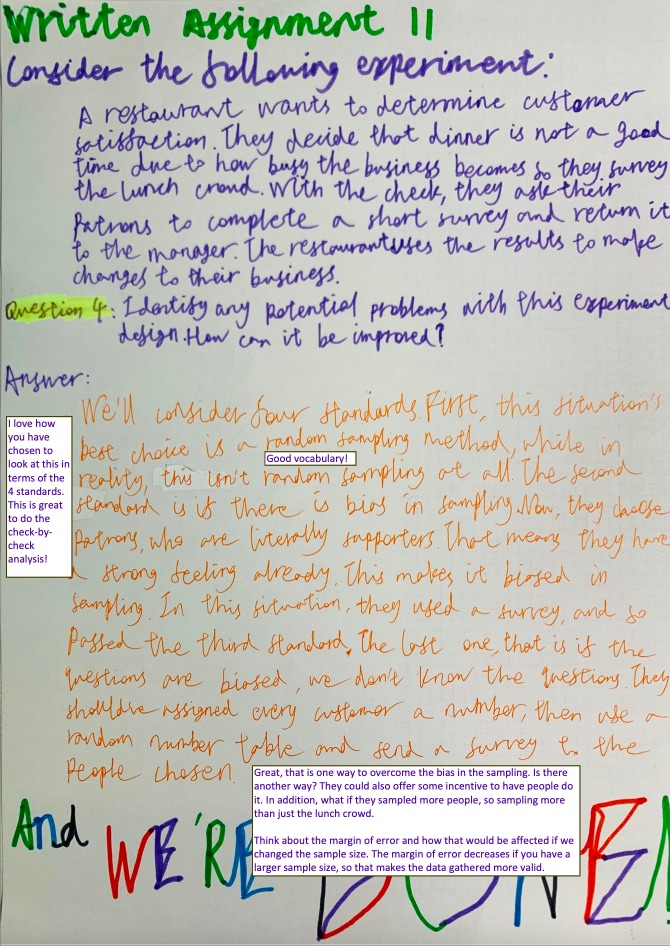
A restaurant wants to determine customer satisfaction. They decide that dinner is a not good time due to how busy the business becomes so they survey the lunch crowd. With the check, they ask their partrons to complete a short survey and return it to the manager. The restaurant uses the results to make changes to their business.
- Identify any potential problem(s) with this experiment design. How can it be improved?
PS: The way that I calculated the mean is to choose the middle(for example, 70-72’s middle is 71) and multiply it by the frequency it corresponds to. I sum these numbers up, and I get 86.9.